2024 in Data: Mapping People, Nature and Climate
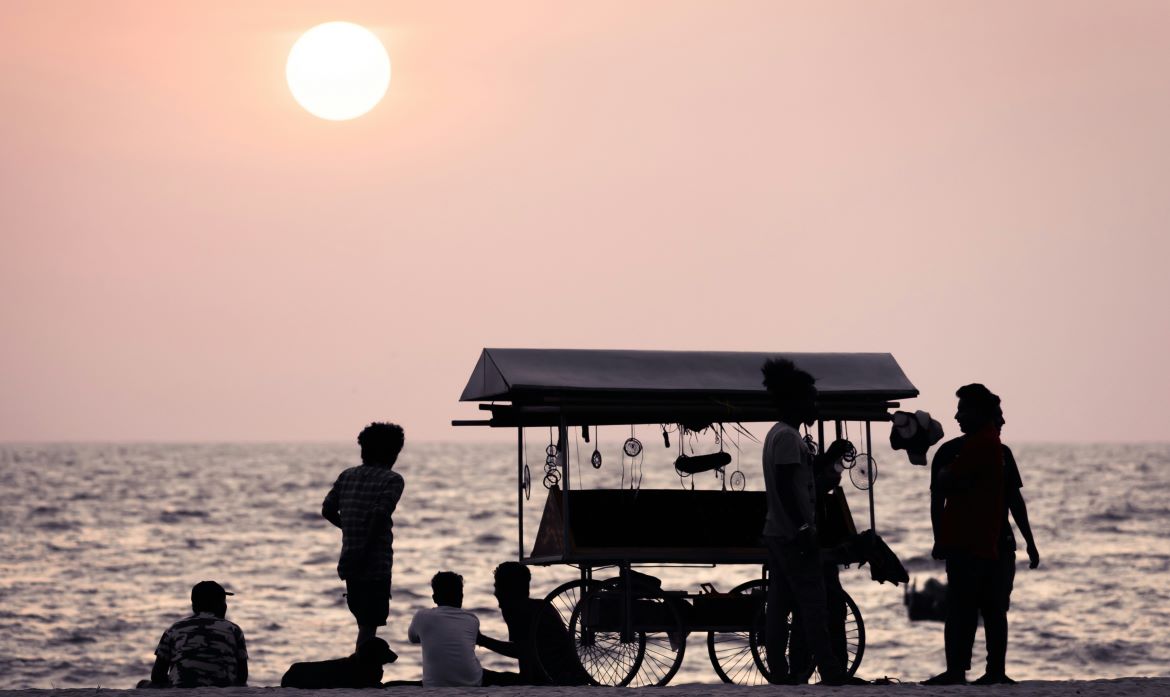
In the book “Klara and the Sun” solar-powered robots, also known as artificial friends (AFs) gently nudge and maneuver themselves by the store window to get their share of sunlight, a prime energy source. In the not-so-distant future (2030), it is projected that more than 40% of India’s population will be living in urban areas and will similarly jostle and compete for access to limited vital resources – food, water and opportunities.
India faces significant vulnerability to climate hazards in both rural and urban landscapes. This year saw record-breaking temperatures, erratic monsoons with prolonged droughts, and extreme rainfall that triggered flooding and landslides, resulting in loss of lives and livelihoods across the country.
Leveraging diverse data sources – census, satellite imagery, data from weather monitoring stations, etc. – and analyzing long term spatial and temporal trends, here’s how our teams used maps and machine learning (ML) to record these changes and their impacts on people, nature and climate in 2024.
CLIMATE
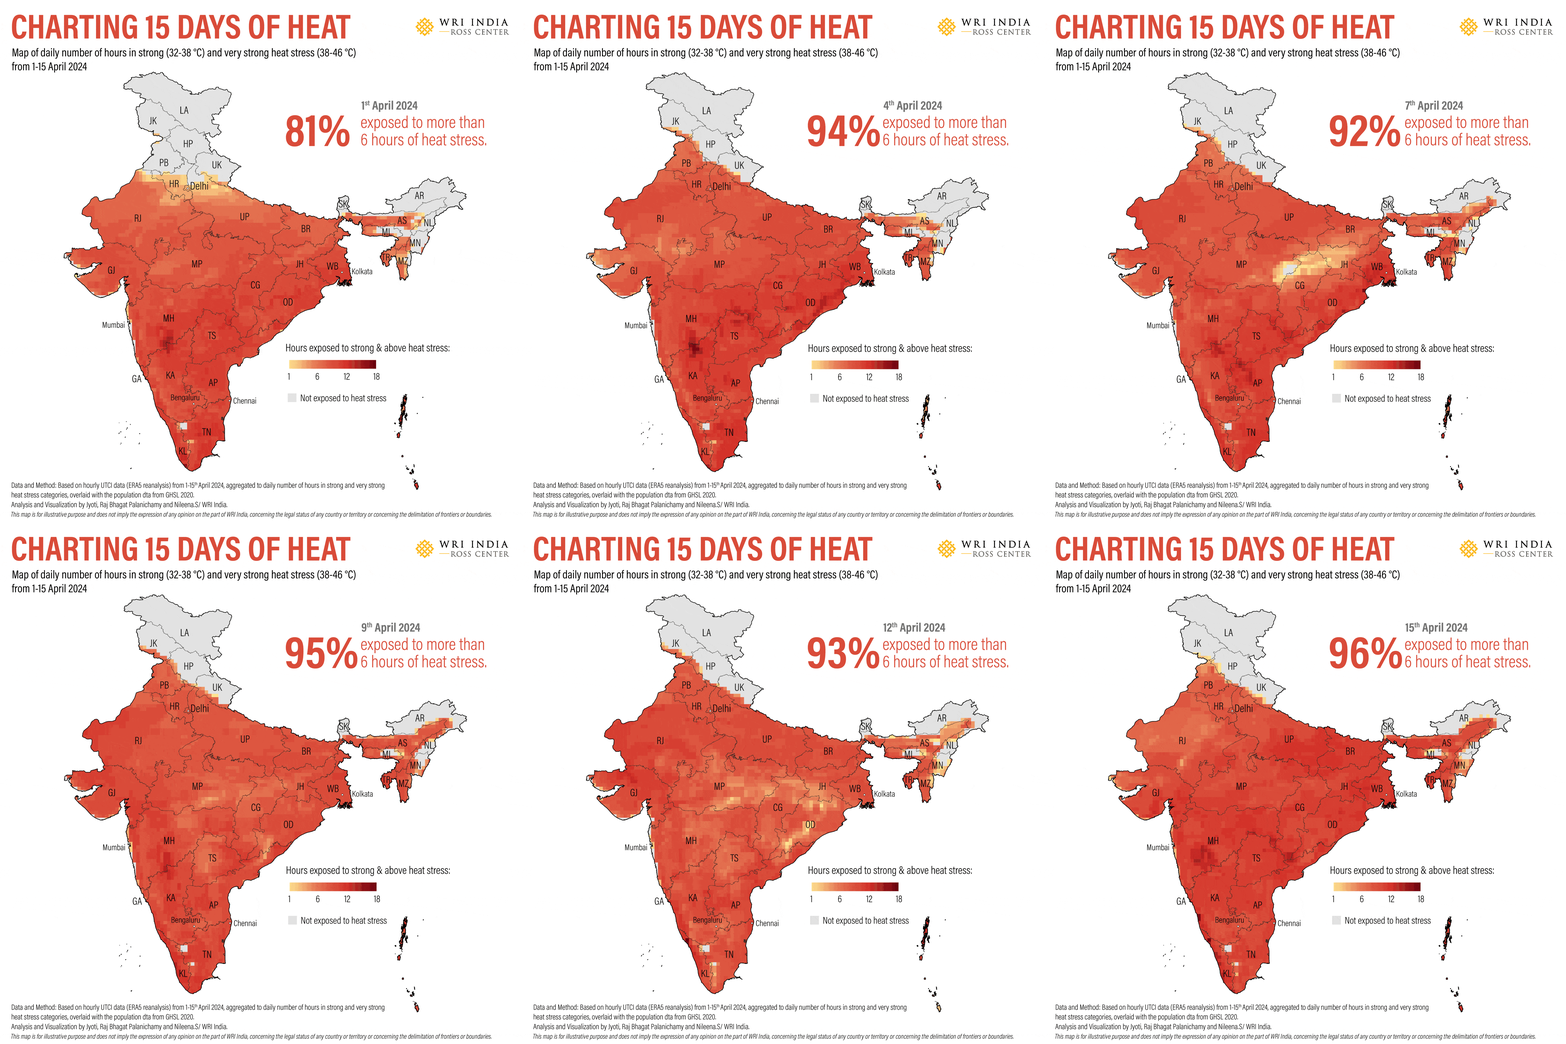
This year, India experienced unprecedented heat waves, with multiple cities recording temperatures over 45 degrees Celsius. As seen in this map, at least 80% of the population was found to be exposed to strong and very strong heat stress for more than 6 hours in the first 15 days of April alone. The fact that 2024 was the warmest year on record and the first year with global average temperatures exceeding 1.5 degrees Celsius above pre-industrial levels, signals the pressing need for cooling solutions, heat response adaptation and mitigation measures.
Increasingly Vulnerable Terrains
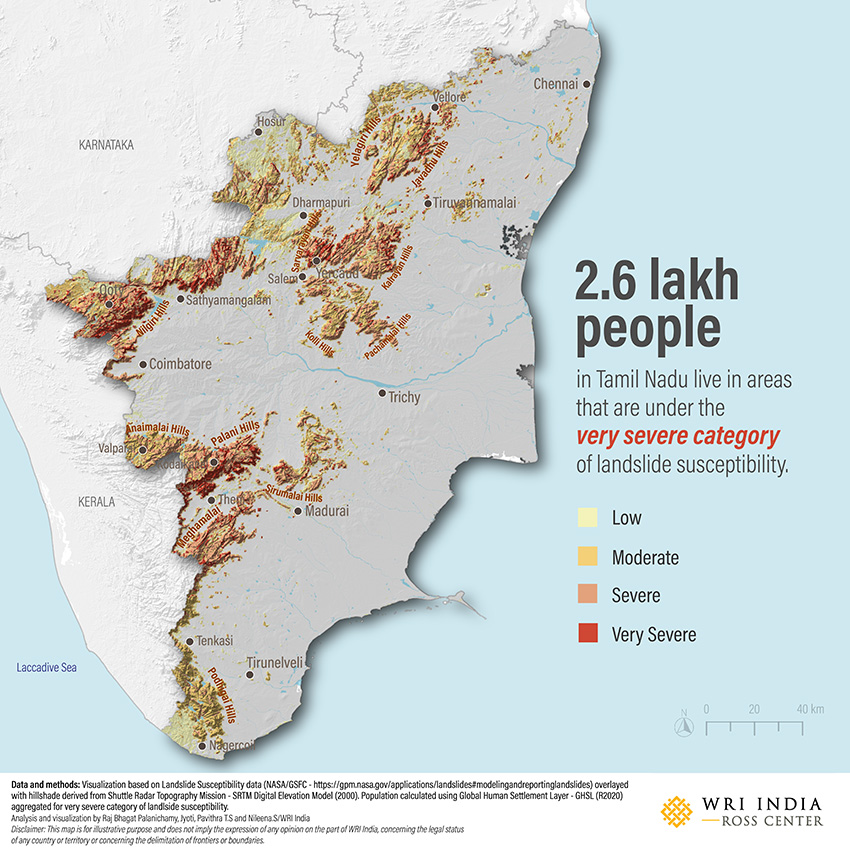
The map below shows the regions in Tamil Nadu that are most prone to landslides, underscoring the urgent need for comprehensive strategies to address environmental stability. The “Climate Resilient Cities: Assessing Differential Vulnerability to Climate Hazards in Urban India” report introduces a unique framework for strengthening climate resilience. It addresses the social drivers of vulnerability with robust analytical methods, data sources and potential outputs. Read more about the role of differential vulnerability in resilience planning here.
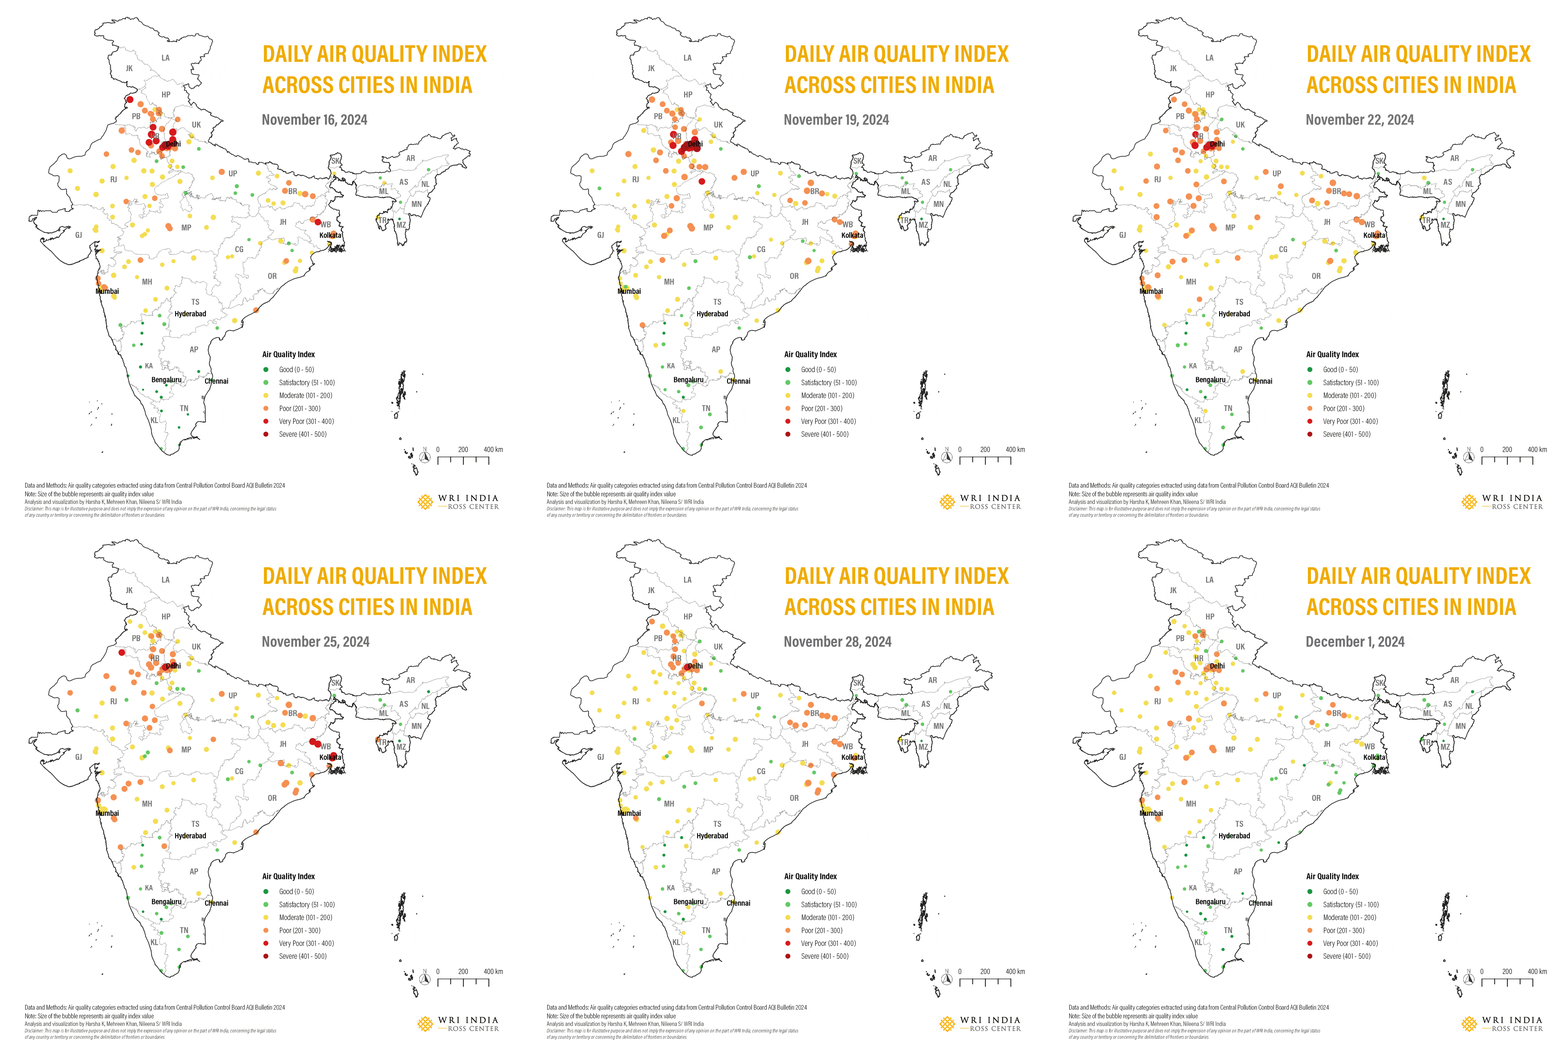
With the onset of winter, many Indian cities witness poor AQI conditions with PM 2.5 as the prominent pollutant. This map charts the daily AQI levels in cities across India with major sources of air pollution – vehicular and industrial emissions, dust from construction and roads, and open waste burning. The Accelerator for Clean Air Actions (ACAAS) initiative is helping cities strengthen local capacity and data-based understanding towards clean air action planning.
NATURE
Locating open spaces for greening and improving citizens’ access to parks, parklets and other green areas is key to making cities more livable. Bengaluru and Mumbai conducted a community-based mapathon to identify such spaces, involving local communities, civil society organizations, academic institutions and resident welfare associations. The map below depicts the locations identified for greening through this exercise across the Bommanahalli zone in Bengaluru.
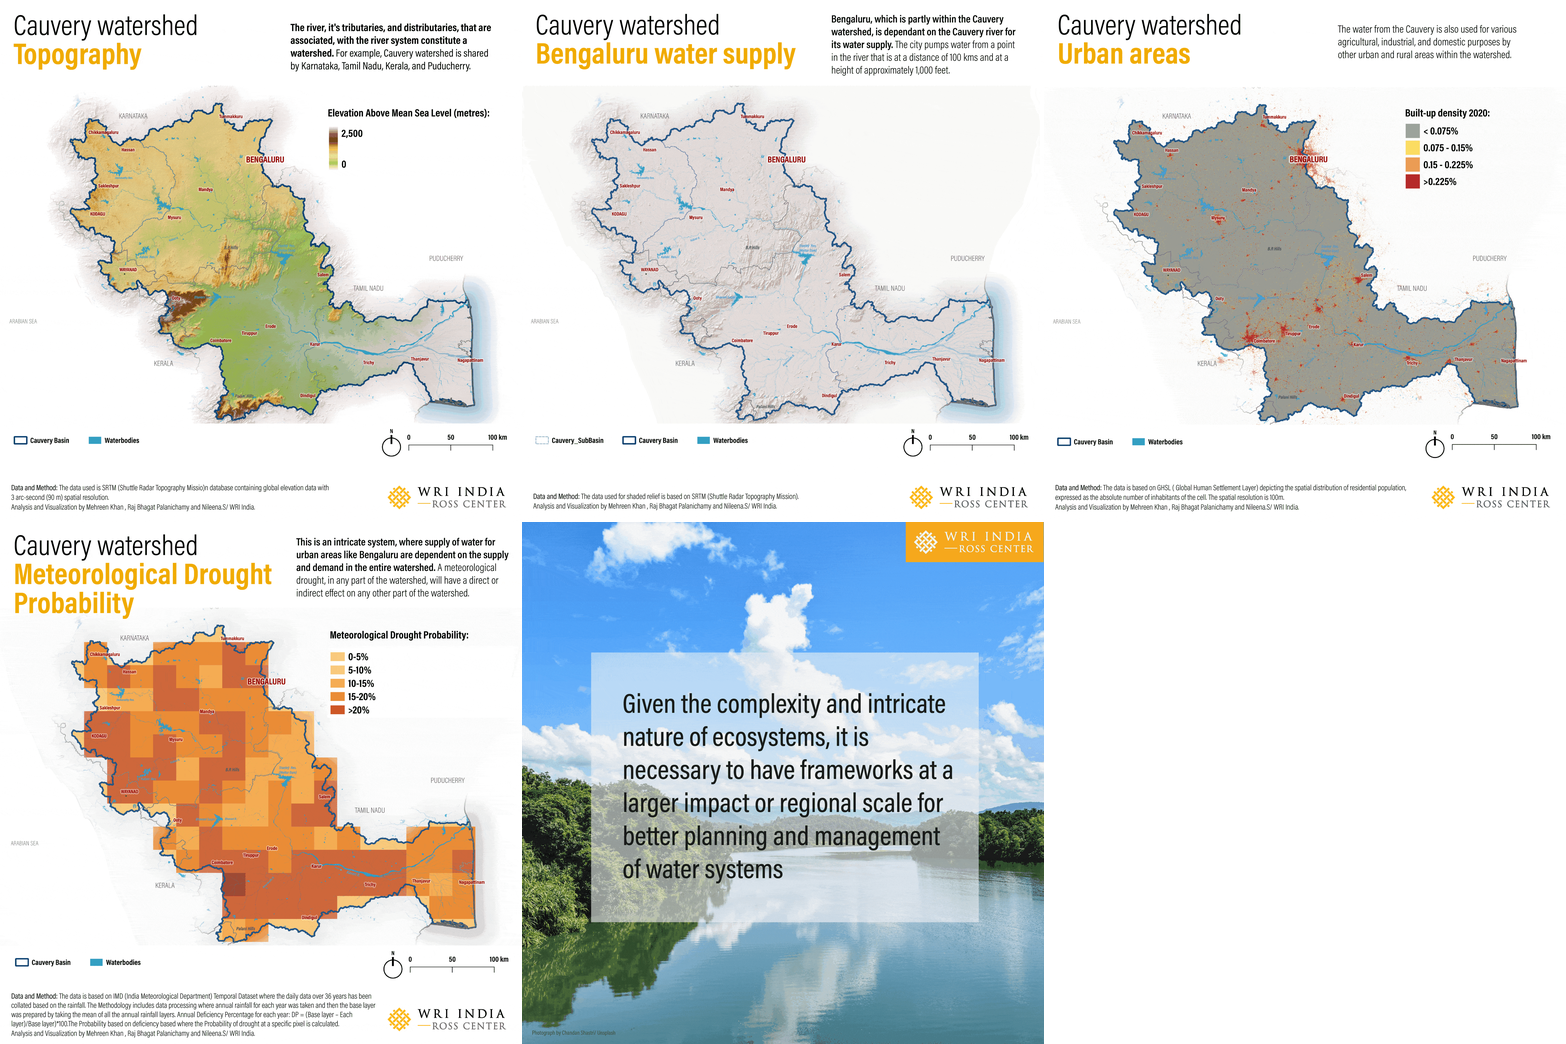
Bengaluru faced a severe water crisis in the early summer months, with many residents resorting to private water tankers for their daily needs. Bengaluru’s water supply is not only dependent on rainfall within city limits for its water but is also reliant on rainfall in the upper Cauvery watershed. Given the complexity and intricate nature of city-region systems, it is imperative to have regional frameworks, at a larger regional and watershed level, for better planning and management of water resources. The map below looks at the Cauvery watershed topography.
PEOPLE
Bridging the Urban Services Gap
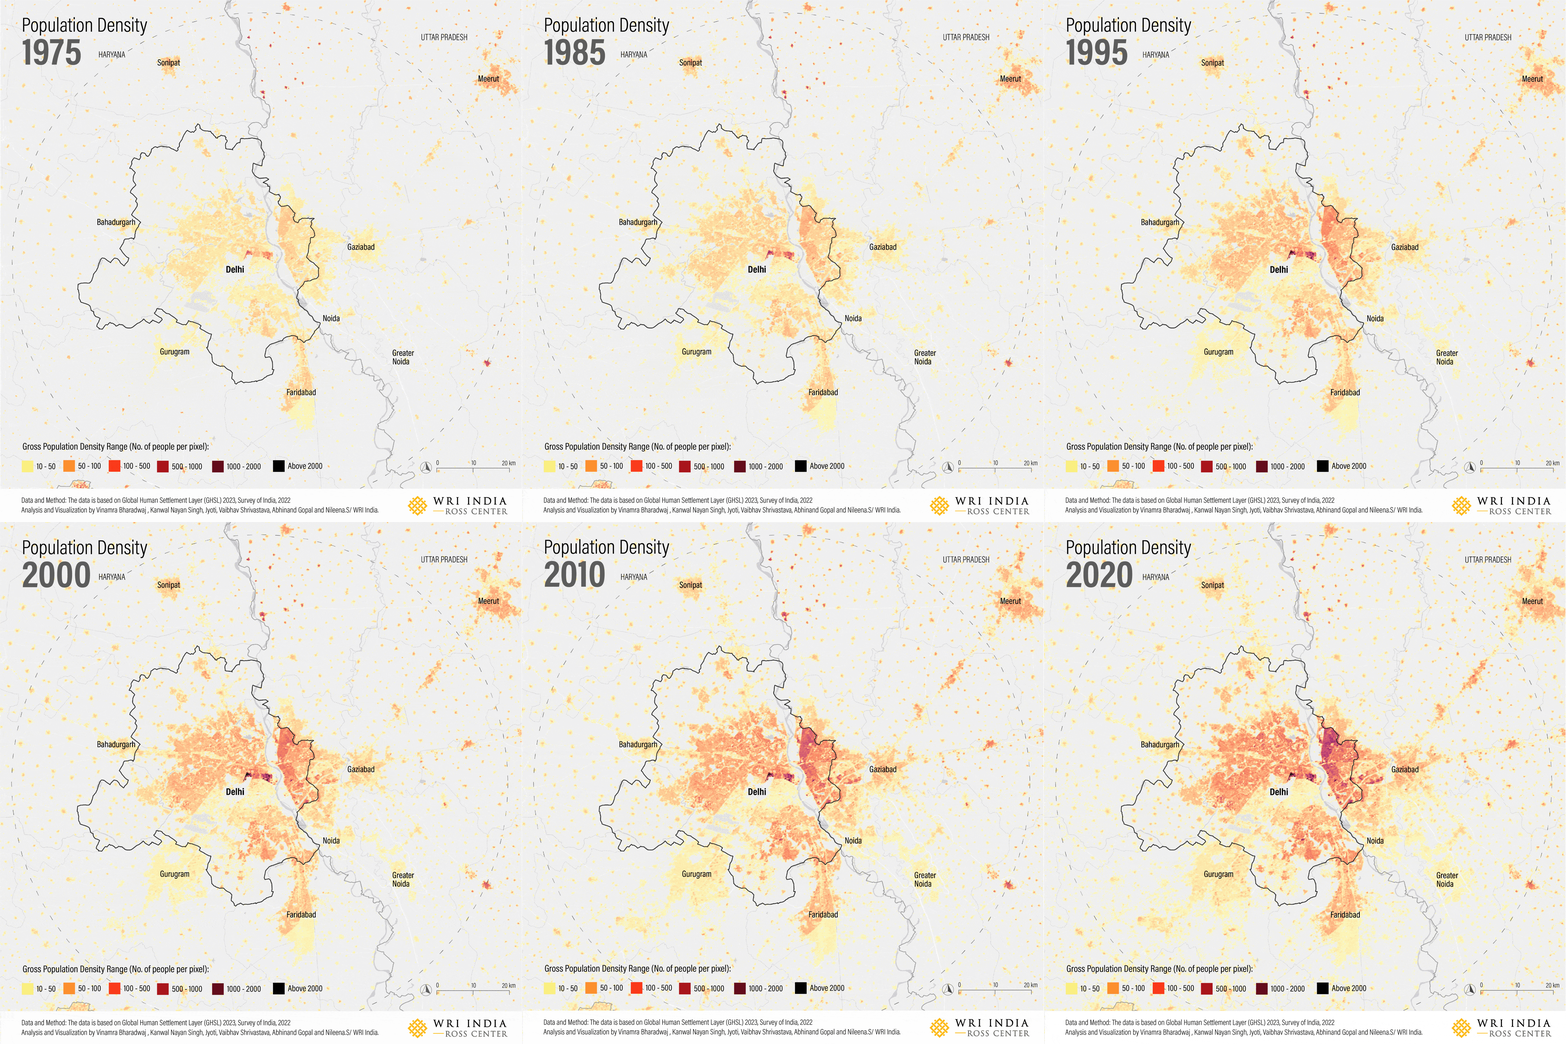
The spatio-temporal visualization below looks at the changing population density from 1975 to 2020 in the Delhi NCT area. Much of the urban expansion in India is concentrated in city peripheries, beyond established municipal boundaries, impacting critical service deliveries such as clean water, sanitation and transportation. While cities have always attracted people looking for work and education, they also need to be equipped for climate migrants gravitating to informal settlements in search of refuge and opportunities.
Ensuring Safety in Public Spaces
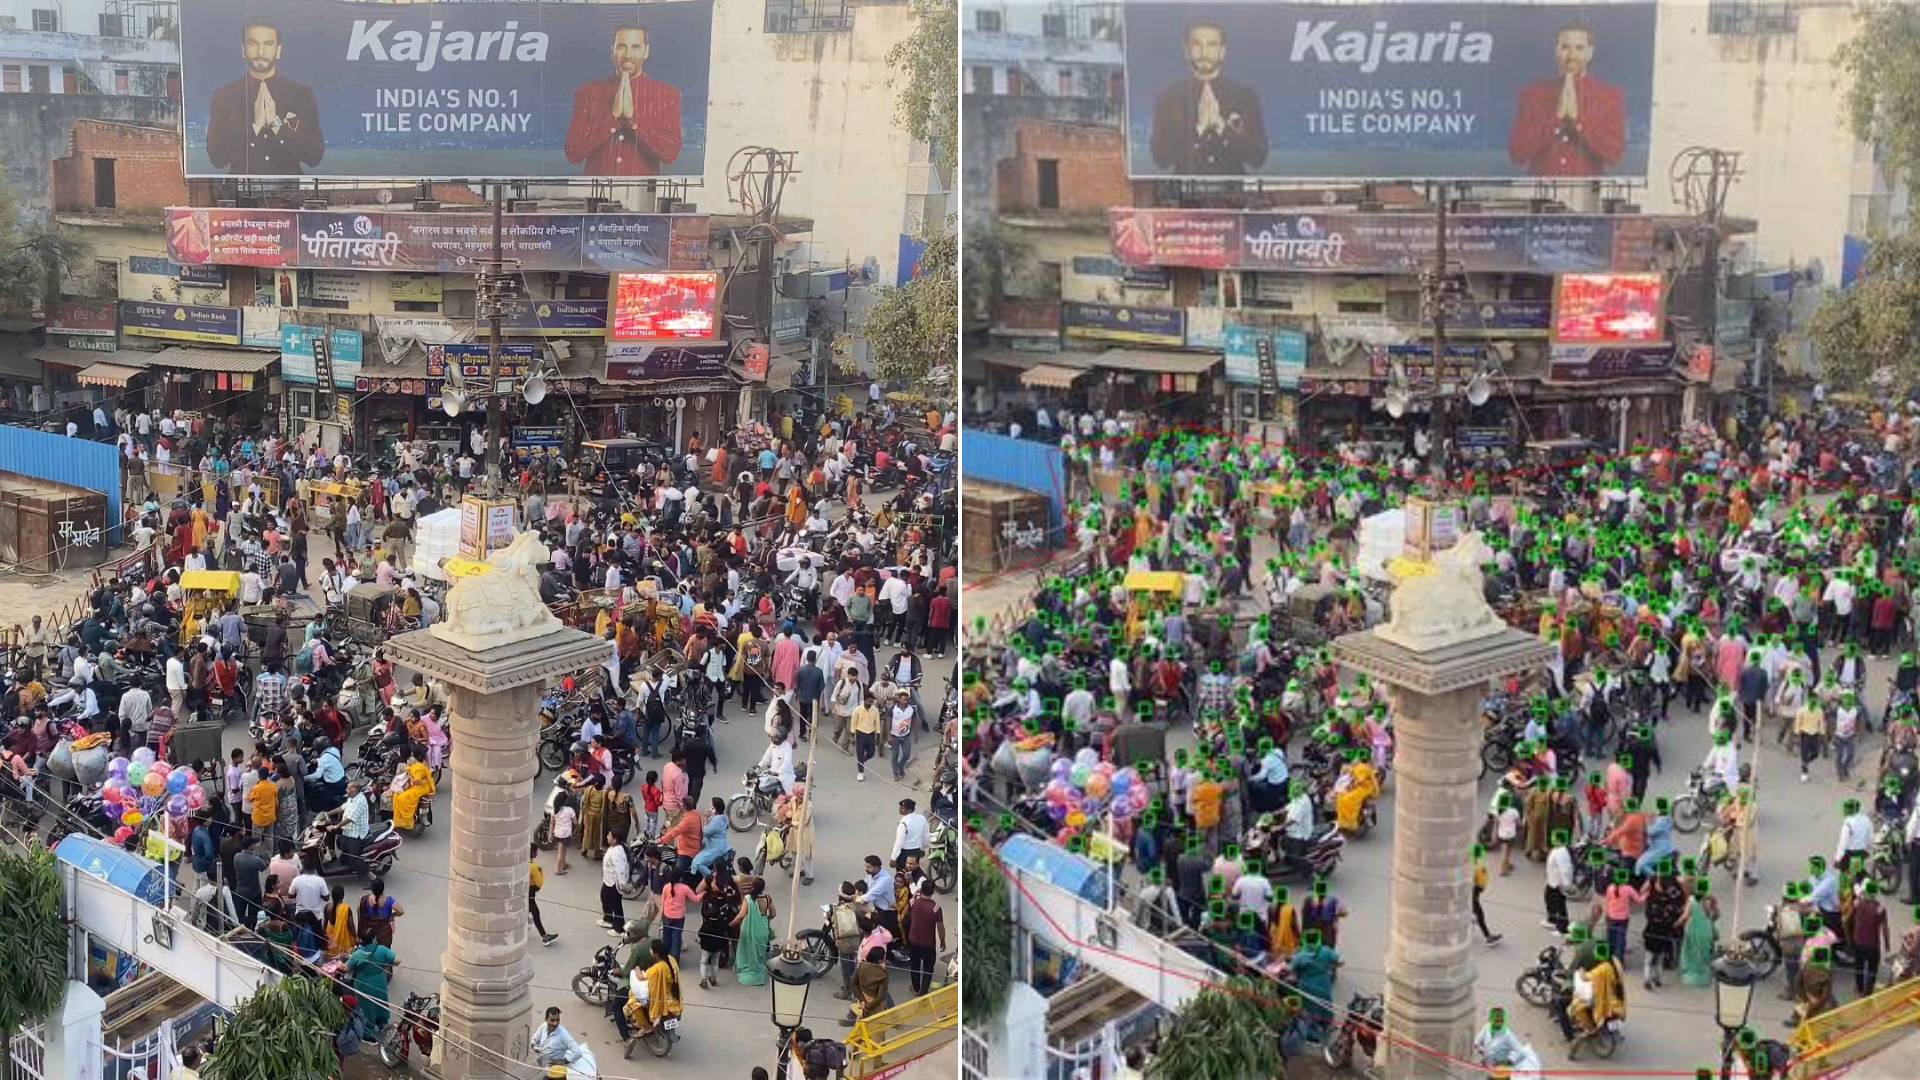
In densely populated cities such as Varanasi, inorganic growth, coupled with tourist influx, exposes the city to overcrowding issues. Leveraging machine learning (ML) techniques, developed in-house, counts of crowds at peak hours across sites in Kashi were assessed. This helped us set a baseline, analyze existing accessibility and safety challenges, and plan how best to address them. In the visual below, the algorithm was able to detect ~480 people (green boxes) in the busy Gadowlia chowk in Varanasi.
Accessing Jobs with Transit Oriented Development
An analysis of job locations in Bengaluru reveals only 28% of the total mapped jobs in the Bengaluru Metropolitan Area (BMA) are within 500 meters (considered a comfortable walking distance) from the nearest metro station. Cities should aim to foster job growth along existing or upcoming transit networks, build high quality walking and cycling infrastructure (within 1 km), and set up efficient feeder services (particularly in the 1-3 km range) to improve access to workplaces. These interventions can also encourage a mode-shift to public transport. This map spatially highlights the jobs distribution and proximity to existing and upcoming metro stations in Bengaluru.
Powering Healthcare in Remote Areas
The Energy Access Explorer (EAE), an open-source, geospatial platform is leveraged by the National Health Mission, Nagaland to host data from the Nagaland Health Project (NHP). This map displays the locations of health facilities solarized under this initiative in Nagaland. EAE is the world’s first Digital Public Good (DPG) dedicated to advancing climate-friendly energy access and supporting energy transitions. Multi-criteria analyses on EAE can help identify potential health facilities for solarization in areas with high energy access potential.
While it is heartening to note that we continue to rank among the top 10 countries in the latest Climate Change Performance Index ratings, the effects of climate change are here to stay. These visualizations capture a lived reality, enabling diverse stakeholders to better understand the challenges at hand and contextualize appropriate solutions.
By highlighting differential vulnerabilities to climate hazards, this approach is helping inform action on ground, from the Varanasi Municipal Corporation working to enhance mobility to the Bruhat Bengaluru Mahanagara Palike (BBMP) launching initiatives to strengthen climate resilience.
As we head into 2025, our work is cut out for us. Leveraging data-driven insights is key to strengthening our ability to adapt to increasing climate risks and ensure the well-being of our world and its inhabitants.
